An old coworker gave me a shout-out that Streamlits latest (1.33.0) release added Fragments.
Fragments simply put enables creation of indepedently updated fragments inside your streamlit application. Further they add a simple run_everywhich simplify dashboards (continuously fetching data).
As always, the documentation explains a lot of how it works.
Play Around
First I play around with fragments, testing the most simple use-case – and I’m sold!
N.B. this is already possible in other tools such as Solara that has a better reactive approach, but streamlit has a bigger user-base and I love to see a solution to this long-standing problem!
import numpy as np
import streamlit as st


def main():
    st.write("# Main Function")
    st.write("Hello, World! (main)")
    st.toggle("Toggle me!")


@st.experimental_fragment()
def first_fragment():
    st.write("## First Fragment")
    random_choice = np.random.choice(["a", "b", "c"])
    st.write(f"Random choice: {random_choice}")
    st.toggle("Toggle me! (1st Fragment)")


@st.experimental_fragment(run_every="2s")
def second_fragment():
    st.write("## Second Fragment")
    st.write("Hello, World! (2nd Fragment)")
    random_choice = np.random.choice(["a", "b", "c"])
    st.write(f"Random choice: {random_choice}")
    st.toggle("Toggle me! (2nd Fragment)")


if __name__ == "__main__":
    main()
    c1, c2 = st.columns(2)

    with c1:
        first_fragment()
    with c2:
        second_fragment()
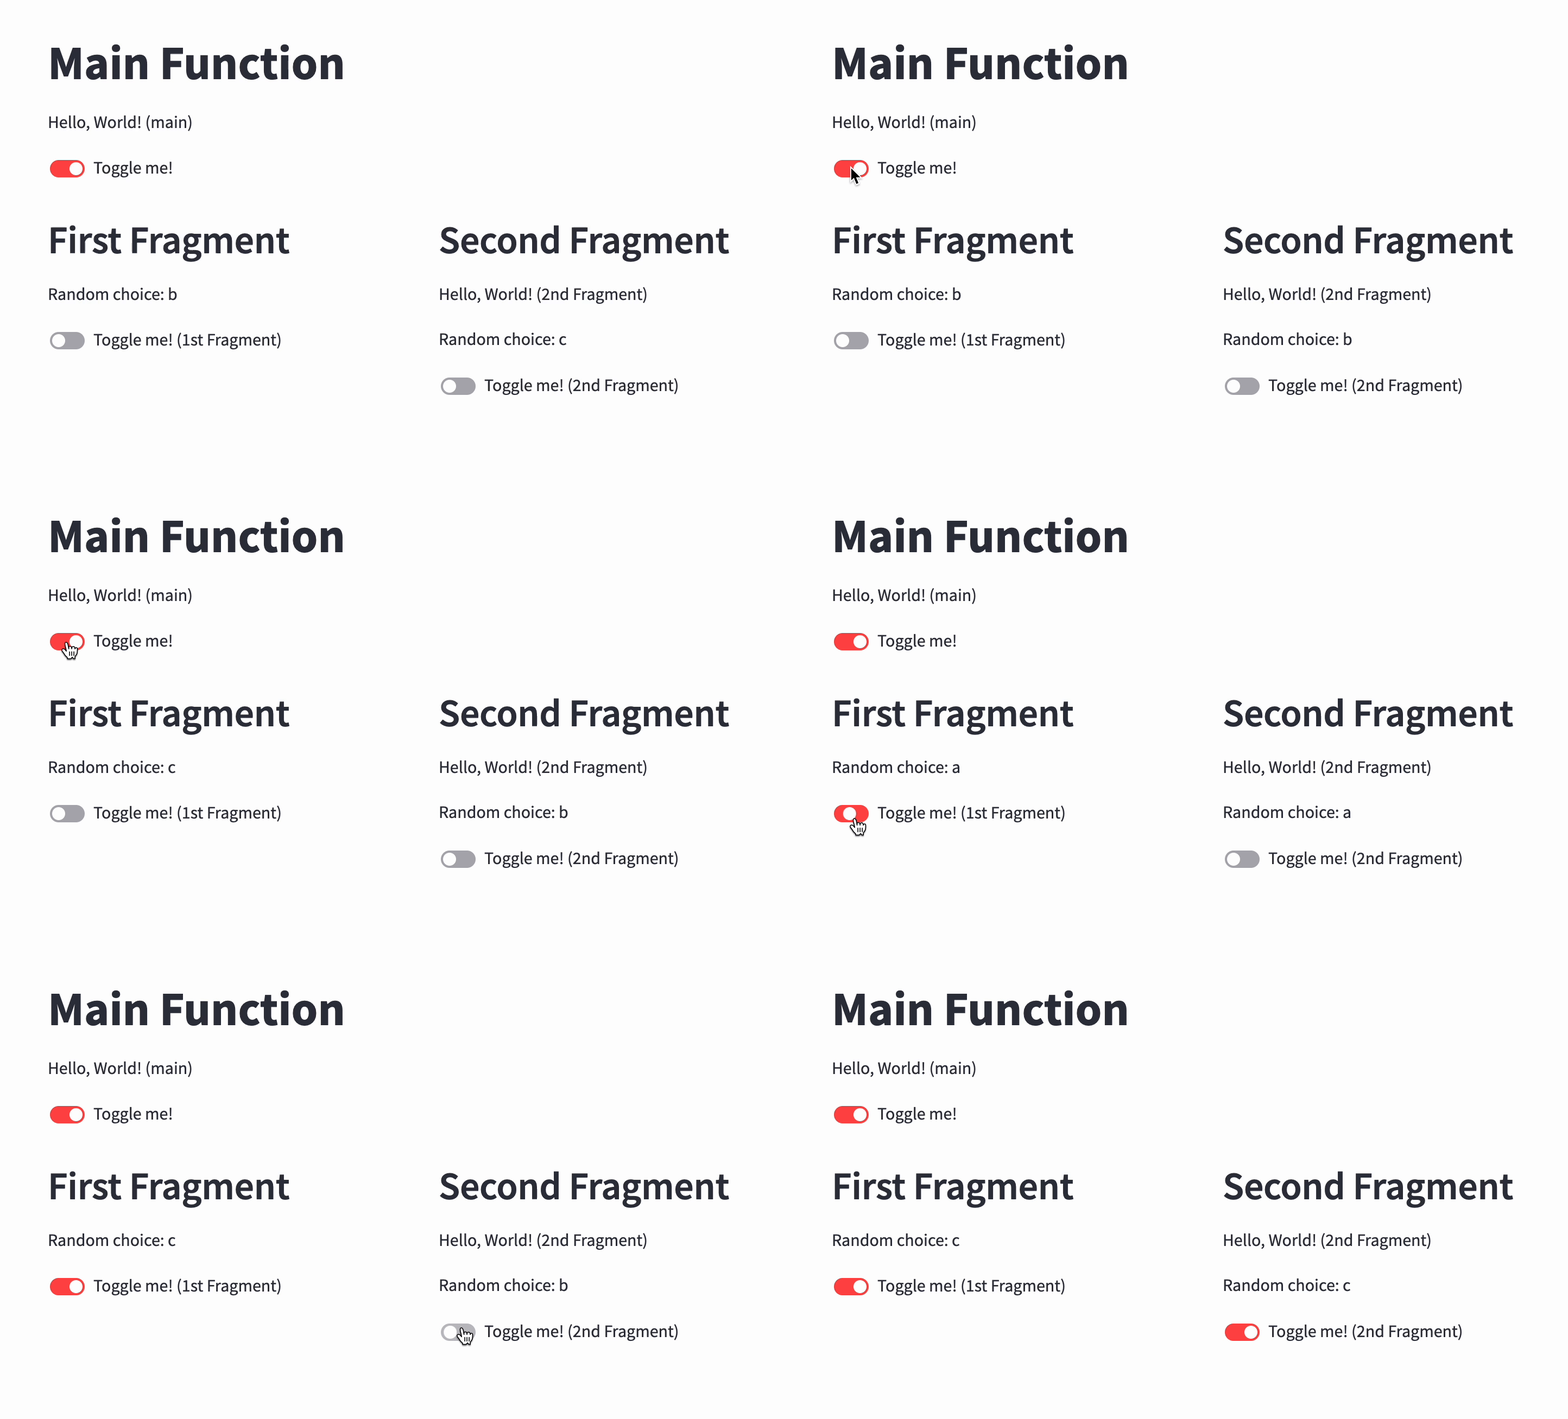
This enables the following behavior:
- Toggling “main” will refresh everything
- Toggling a fragment will only refresh that fragment
- Second fragment will refresh every 2 seconds
What is refreshed? The Random choice letter is updated to a random letter (a, b, or c).
All in all this is what we’d probably do in a Dashboard. See the following GIF’s:

Adding Complexity
As always it’s a lot more fun to test these things in scenarios that are closer to real-life, and that’s what I intend to do!
- Fetching data from a data storage
- Displaying different graphs
- Sharing state from main
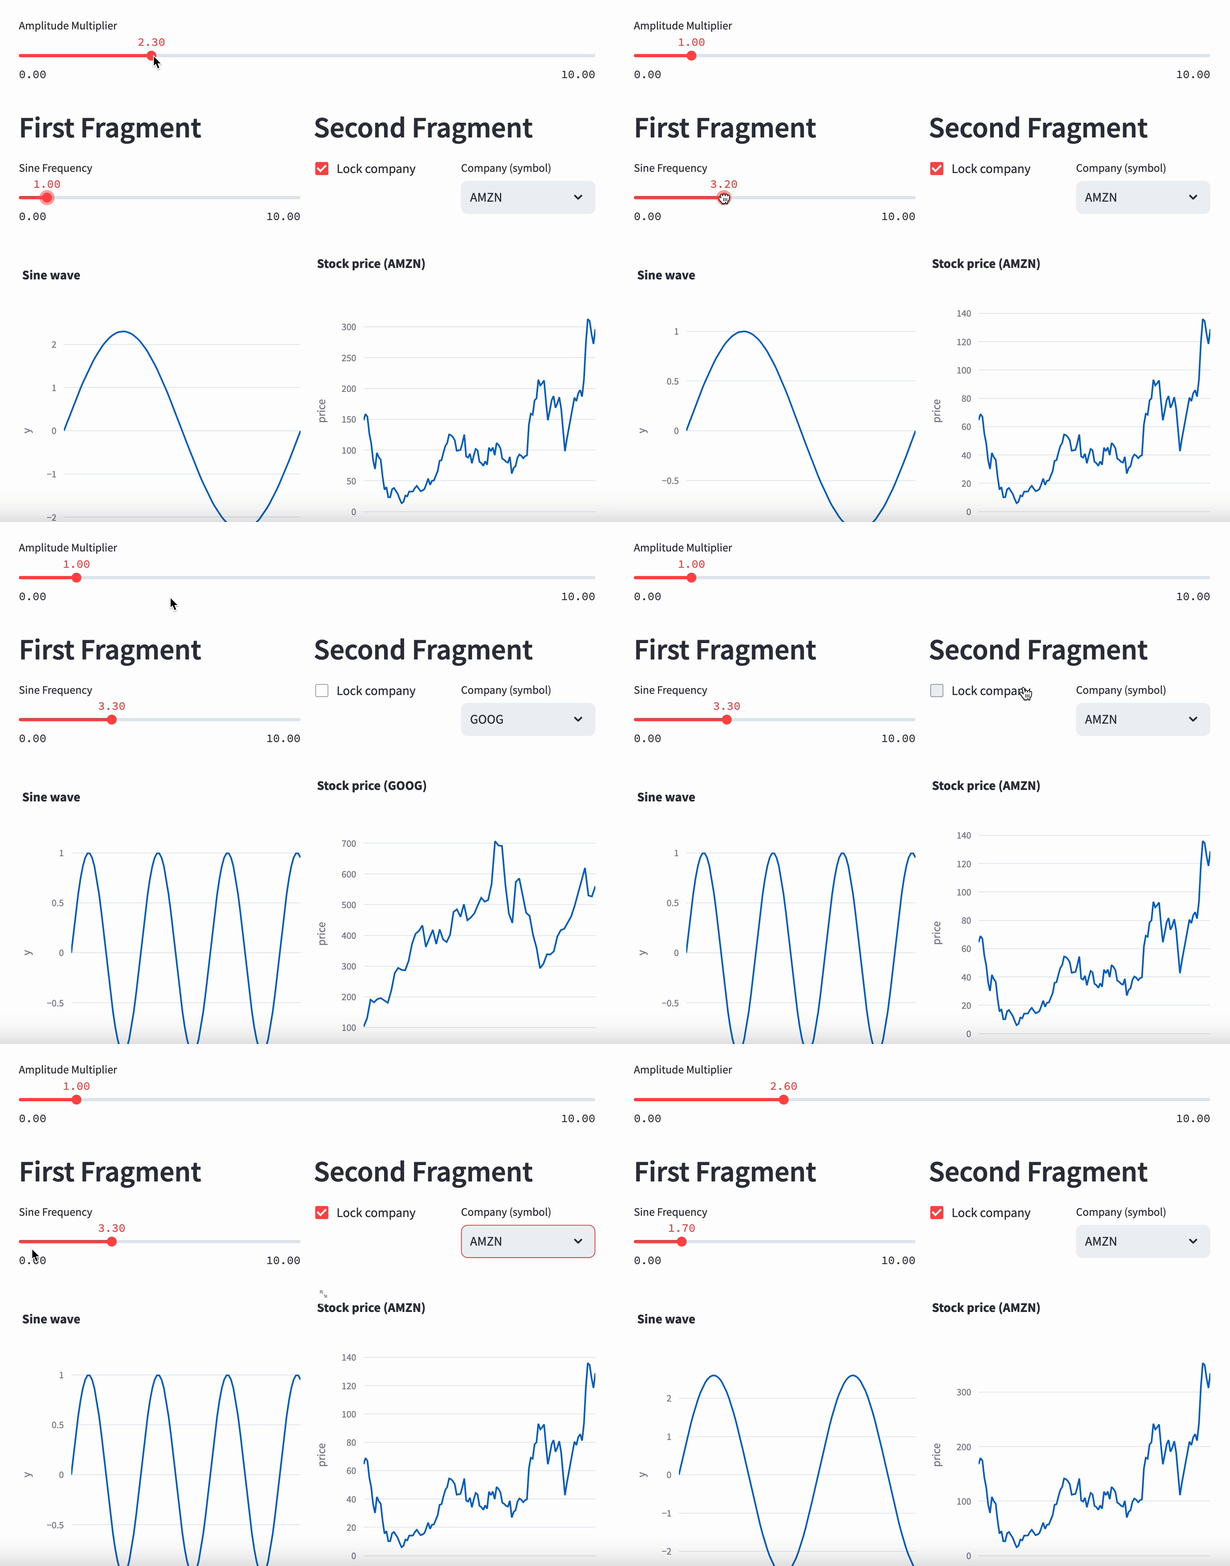
In this graph we have a Amplitude Multiplier (main) that affects both fragments, additionally we have a sine wave where the frequency is editable and will only re-render (re-compute) that fragment (first). Finally there’s a Stock Fragment (second) which automatically updates every 2 seconds, unless locked it’ll randomly select a stock, if locked we can still change stock and it’ll only re-render that fragment (second).
See the GIF below! 👇

import numpy as np
import streamlit as st
import polars as pl
import plotly.express as px


def main() -> float:
    st.write("# Main Function")
    st.write("Hello, World! (main)")
    multiplier = st.slider("Amplitude Multiplier", 0.0, 10.0, 1.0, 0.1)

    return multiplier


@st.cache_resource
def get_stocks() -> pl.DataFrame:
    return pl.read_csv(
        "https://raw.githubusercontent.com/vega/datalib/master/test/data/stocks.csv"
    )


@st.experimental_fragment()
def first_fragment(multiplier: float):
    st.write("## First Fragment")
    sine_frequency = st.slider("Sine Frequency", 0.0, 10.0, 1.0, 0.1)
    # create sine wave with multiplier height and sine_frequency as frequency
    t = np.linspace(0, 2 * np.pi * sine_frequency, 100)
    y = multiplier * np.sin(t)

    df = pl.DataFrame({"t": t, "y": y})
    st.plotly_chart(
        px.line(df, x="t", y="y", title="Sine wave"), use_container_width=True
    )


@st.experimental_fragment(run_every="2s")
def second_fragment(multiplier: float):
    st.write("## Second Fragment")
    c1, c2 = st.columns(2)

    with c1:
        if not st.checkbox("Lock company"):
            st.session_state["ticker_select"] = np.random.choice(
                ["AAPL", "GOOG", "AMZN"]
            )
    with c2:
        ticker = st.selectbox(
            "Company (symbol)", ["AAPL", "GOOG", "AMZN"], key="ticker_select"
        )
    stocks = get_stocks()
    stocks = stocks.filter(pl.col("symbol") == ticker).with_columns(
        pl.col("price") * multiplier
    )

    st.plotly_chart(
        px.line(stocks, x="date", y="price", title=f"Stock price ({ticker})"),
        use_container_width=True,
    )


if __name__ == "__main__":
    multiplier = main()
    c1, c2 = st.columns(2)

    with c1:
        first_fragment(multiplier)
    with c2:
        second_fragment(multiplier)
Drawbacks
This solution doesn’t fit every scenario, and as usual with Streamlit, integrating it introduces complexity via state management. Fragments add another level atop the existing st.state, potentially introducing more intricacies and headaches.
Other solutions such as Solara and Panel has this more built into the solution, but then again their entry threshold is a lot higher!
Outro
Any other questions? Please go ahead and ask!
This development is exciting and will for sure give Streamlit new life in “efficiency”. I, for one, am happy to see all new Data Apps fighting!
Finally, all the code is available on this blogs github under code_snippets.
/ Hampus Londögård